Writing Task 1 — Describe the Visual
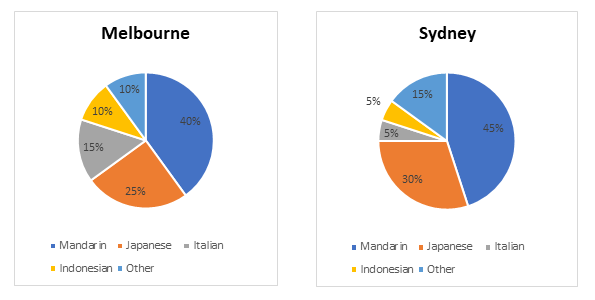
The pie charts above show the percentage of the languages spoken in two different cities in Australia: Melbourne and Sydney.
Summarise the information by selecting and reporting the main features, and make comparisons where relevant.
Write at least 150 words.
Summarise the information by selecting and reporting the main features, and make comparisons where relevant.
Write at least 150 words.